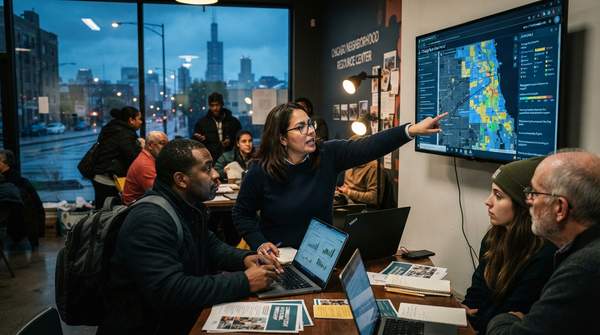
Chicago residents and community leaders who want data to back up a neighborhood argument do not need a statistics degree or coding skills. The City of Chicago's open data portal, in the city's own description, lets residents find city data, find facts about their neighborhood, create maps and graphs, and freely download data for their own analysis, with many datasets updated at least once a day. The practical challenge is knowing how to search with a specific concern in mind, and understanding one piece of local geography: nearly all city data is organized by "community area," not by the informal neighborhood names residents actually use.
Navigating Chicago's Data Portal for Neighborhood Concerns
The portal is best approached as a search tool rather than a library to browse. Start by writing down the concrete question behind your concern, because a vague worry about "safety" or "development" maps to different datasets than a specific question such as "how many service requests were made about my block this year?" The city describes the portal as a place to find facts about your neighborhood and to build maps and graphs, which means a resident can move from question to visual evidence without specialized software.
Several of the portal's tools lower the barrier further. OpenGrid, which the city highlights, lets residents and visitors navigate Chicago's data based on where they are or where they want to explore, and now allows sharing the resulting maps with others. The city's own examples of what you can pull up this way are instructive for neighborhood advocates: restaurants failing a food inspection in the past month, new business licenses issued within a few blocks, and potholes filled nearby. Those are exactly the kinds of concrete, location-specific facts that make a community meeting more productive than general impressions.
Update frequency matters for interpretation. Many datasets are refreshed at least daily, and some several times a day, so a resident checking service requests or complaint data should expect recent records to appear quickly, and should note the date of any figures they cite in a flyer or presentation.
Connecting Neighborhood Concerns to Chicago Data Portal Datasets
The fastest way to move from a real-world concern to a targeted search is to translate the concern into the categories of data the portal actually holds. The matrix below maps three of the most common neighborhood planning questions onto the kinds of datasets the city makes available, using the portal's own described contents as the guide.
| If your concern is… | Relevant portal data | What to look for |
|---|---|---|
| Public safety and city oversight | Complaint datasets, including police complaint records | The nature of the complaint, time of complaint, status and findings, whether it was a police-involved shooting, and basic demographic information |
| Local business conditions and sanitation | Service requests, food inspection results, and business license records | Restaurants failing inspections in a given period, and new business licenses issued within a few blocks |
| Street conditions and city responsiveness | Service requests and street-maintenance records | Potholes filled nearby, plus the service request number, which the city says can be used to check current status and the responsible department |
The reasoning path is straightforward: each row starts with a question a resident might raise at a community meeting, matches it to a dataset type the portal demonstrably contains, and names the specific fields worth pulling. A resident worried about restaurant conditions, for example, can identify two or three dataset types immediately, inspection results, business licenses, and service requests, rather than browsing aimlessly through hundreds of datasets.
Understanding Chicago's Community Areas vs. Neighborhoods
Once you find a dataset, the most common stumbling block is geographic. Chicago's 77 community areas were mapped out in the late 1920s by two University of Chicago sociologists, Robert E. Park and Ernest Burgess, who grouped together neighborhoods and surrounding areas. Except for the addition of O'Hare in 1956 and Edgewater in 1980, those boundaries have remained unchanged, and most publicly available data about the city relies on these units.
Residents, however, usually identify more strongly with their neighborhood, which is generally a smaller spatial unit sharing one or more common architectural, linguistic, economic, historic, or cultural identities. Community areas are distinct from, but related to, neighborhoods. This distinction is not academic: if you search a dataset for "Logan Square" or "Pilsen" as you use those names, you may miss records filed under a community area number that covers a different, larger footprint.
The Chicago Metropolitan Agency for Planning, which publishes neighborhood-scale Community Data Snapshots, explains the same trade-off from the data-producer side: it uses Chicago's community areas, the official borders the city uses to collect data, because they are static boundaries for analyzing population data since the 1920s, while neighborhoods are fluid and can change depending on the year and on who you ask. CMAP also notes that original files can be downloaded from its Data Hub. Before analyzing any city dataset, find which community area contains your neighborhood, and treat community-area figures as covering that whole area, not just your blocks.
From Data Discovery to Community Action
Finding the numbers is only half the work; the other half is making them matter to neighbors and decision-makers. One established method is the "Data Walk," described by the Urban Institute as an in-person event where data and findings are shared directly with community residents. The format is flexible: facilitators can compile a simple list of observations from stations, or allow deeper conversation to build consensus, and can even identify next steps and strategies in response to new understanding of a community's needs and strengths. One documented example closed with an informal summary of participants' comments, targets for change, and barriers to achieving those targets, a structure any block club or advisory council could adapt.
Chicago also has a civic technology ecosystem that residents can plug into. A case study of the city's open data history by the Urban Institute describes Open City, a volunteer group that creates apps to improve government transparency and citizen understanding, and the Smart Chicago Collaborative, a civic organization started in 2011 that works to bridge the for-profit and nonprofit sectors and facilitates widespread use of civic data through projects such as an online Health Atlas and digital skills training. The same case study notes that a data competition managed by MCIC brought together software developers, nonprofits, and residents to create more than 50 web and mobile applications, evidence that resident participation is a built-in feature of this ecosystem, not an afterthought.
Empowering Your Community with Data
Residents and community leaders can effectively use the City of Chicago Data Portal to inform neighborhood planning and advocacy by understanding the portal's dataset categories, working within the community-area geography that structures the data, and then moving from private analysis to public conversation through methods like Data Walks and local civic tech groups. The guide's limits are worth restating: this is an approach to finding and interpreting data, not training in statistical analysis or coding, and not a substitute for legal interpretation of zoning or building codes.
The measurable indicator of success is concrete: increased community-led initiatives or discussions that reference specific data points from the Chicago Data Portal. A practical first milestone is a single community meeting where a resident presents one map or figure, drawn from a named dataset and filtered to a specific community area, and the group records what it wants to change and what stands in the way.
Sources
- City of Chicago | Data Portal | City of Chicago
- Community Data Snapshots — Chicago Metropolitan Agency for Planning
- URBAN: Data Walk
- URBAN: Open City